
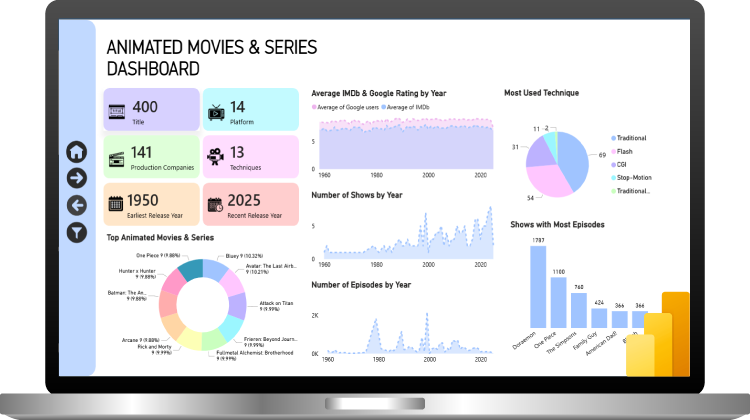
Animated Movies & Series Analytics Dashboard
Developed an interactive Power BI dashboard to analyze performance of animated movies and series using metrics such as ratings, viewership trends, genre popularity, and release year analysis.
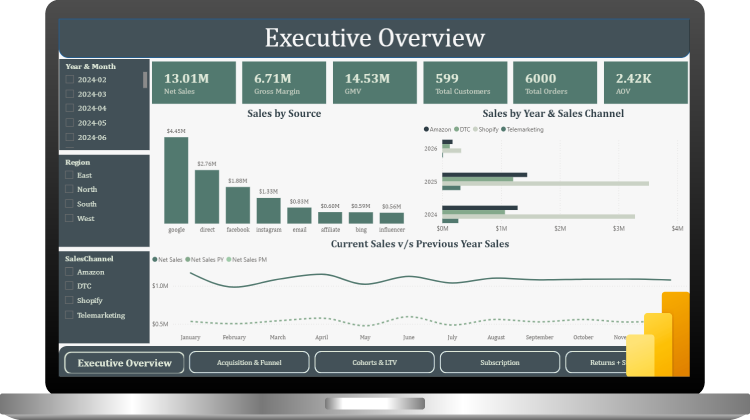
E-Commerce Performance Analytics Dashboard
Developed an interactive Power BI dashboard to analyze e-commerce performance, including sales revenue, order volume, customer trends, and product performance across different time periods.
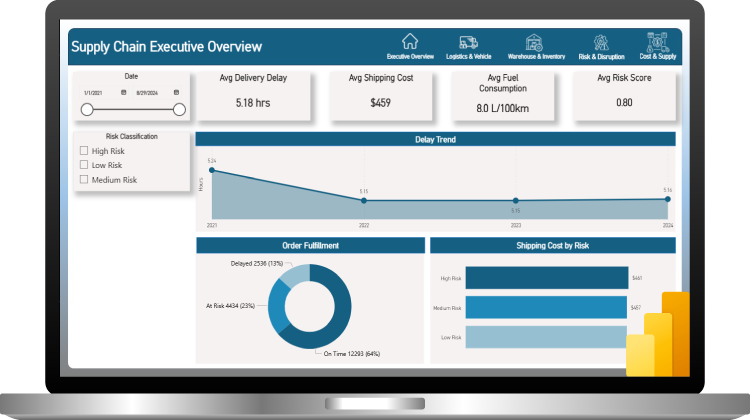
Supply Chain Performance Analytics Dashboard
Developed an interactive Power BI dashboard to analyze supply chain performance, including inventory levels, order fulfillment rates, delivery times, and supplier performance.
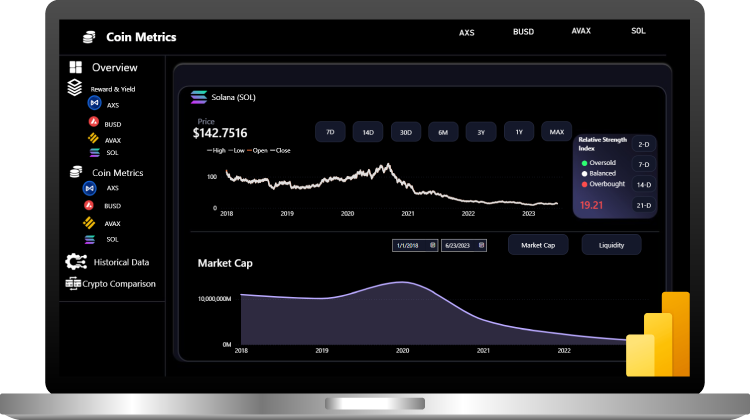
Crypto Stacking & Performance Dashboard
Developed an interactive Power BI dashboard to track and analyze crypto staking performance, including staked assets, rewards earned, yield rates, and portfolio growth over time.
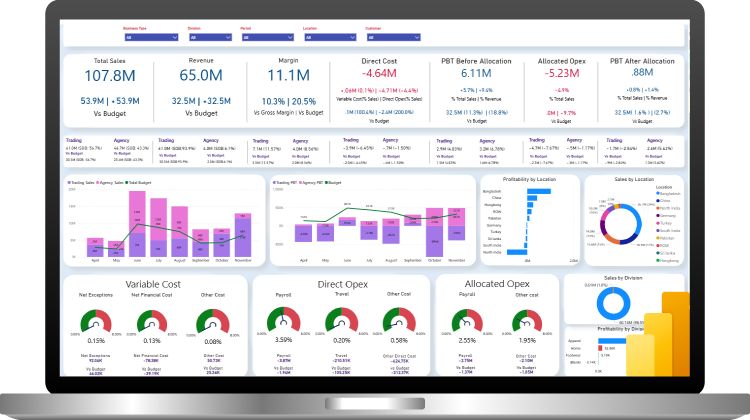
Enterprise Financial Performance Dashboard
Developed a comprehensive Power BI dashboard to monitor enterprise financial performance, including revenue, expenses, profit margins, and cash flow trends across different departments and time
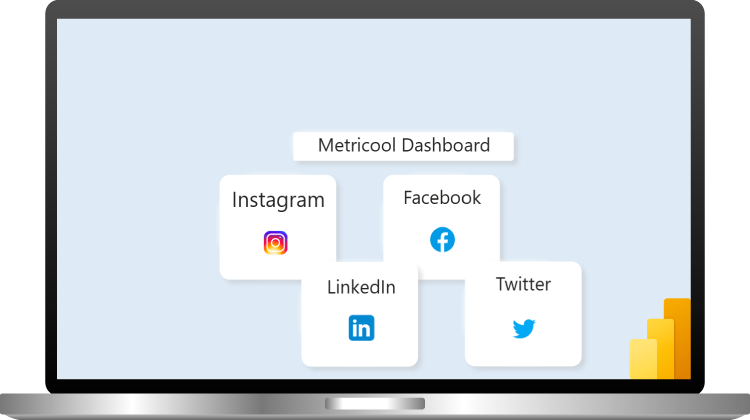
Social Media Performance Dashboard
Developed an interactive Power BI dashboard to monitor and analyze social media performance across multiple platforms using key metrics such as engagement, reach, impressions, and follower growth.
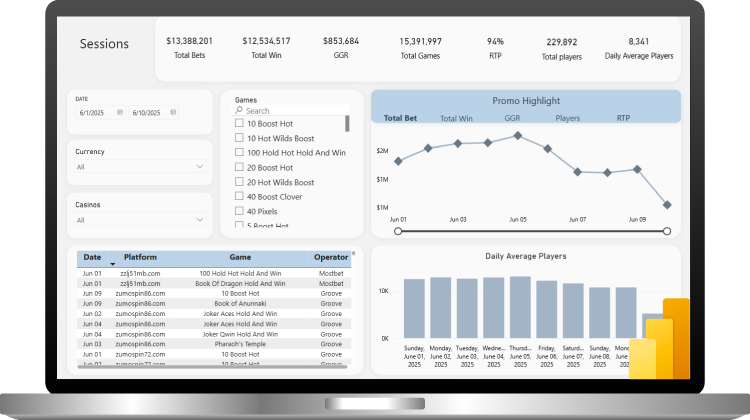
Gaming Sessions & Revenue Performance Dashboard
The dashboard provides insights into session trends, player engagement, and revenue generation, helping stakeholders monitor performance and optimize gaming strategies.
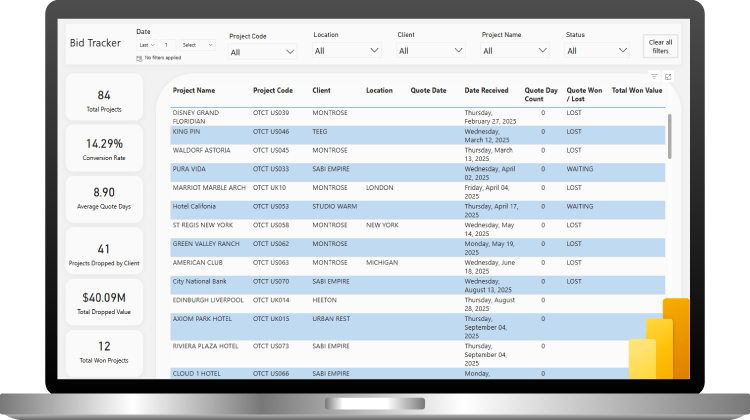
Project Bid Analytics & Revenue Performance
The dashboard provides insights into bid success rates, revenue trends, and project profitability, enabling data-driven decision-making and improved sales strategy.
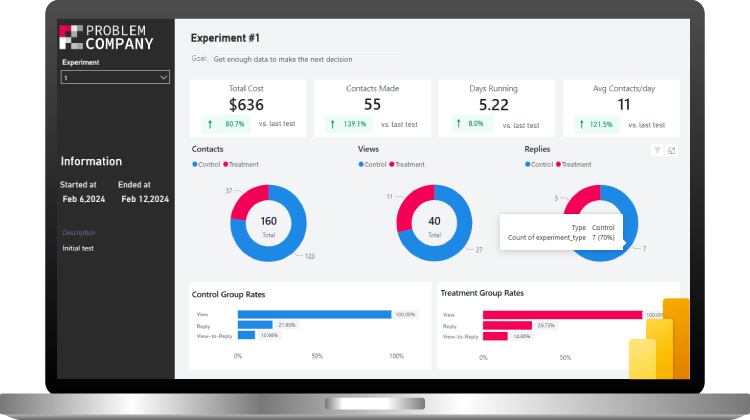
A/B Experiment Performance Dashboard
Developed an interactive A/B Experiment Performance Dashboard in Power BI to compare variant performance using key metrics such as conversion rate, click-through rate, and user engagement.
- 1
- 2